Mapper of the Month: Koos Krijnders (The Netherlands)
01.01.2022 - Pierre Parmentier
His homepage and his contributor page.
- Hello Koos! Would you like to briefly introduce yourself to our readers?
- I am Koos Krijnders, already a few years pensionado as far as the financial side is concerned, but far from pensionado when it comes to making maps. Long ago I graduated as a geographer from the University of Amsterdam and as a cartographer from the University of Utrecht. I worked for the municipality of Lelystad and then as an independent consultant for various government organisations, but also for the cartography department of the Royal Dutch Tourist Association ANWB. In that time (between 1985 and 1995), I was involved in the preparation and construction of the basic databases for addresses and buildings (the BAG) — a file constructed and maintained by the municipalities. This file is now included in OpenStreetMap. This means that the buildings that were already in it were removed in OpenStreetMap, to the chagrin of many who had put a lot of hours into this.
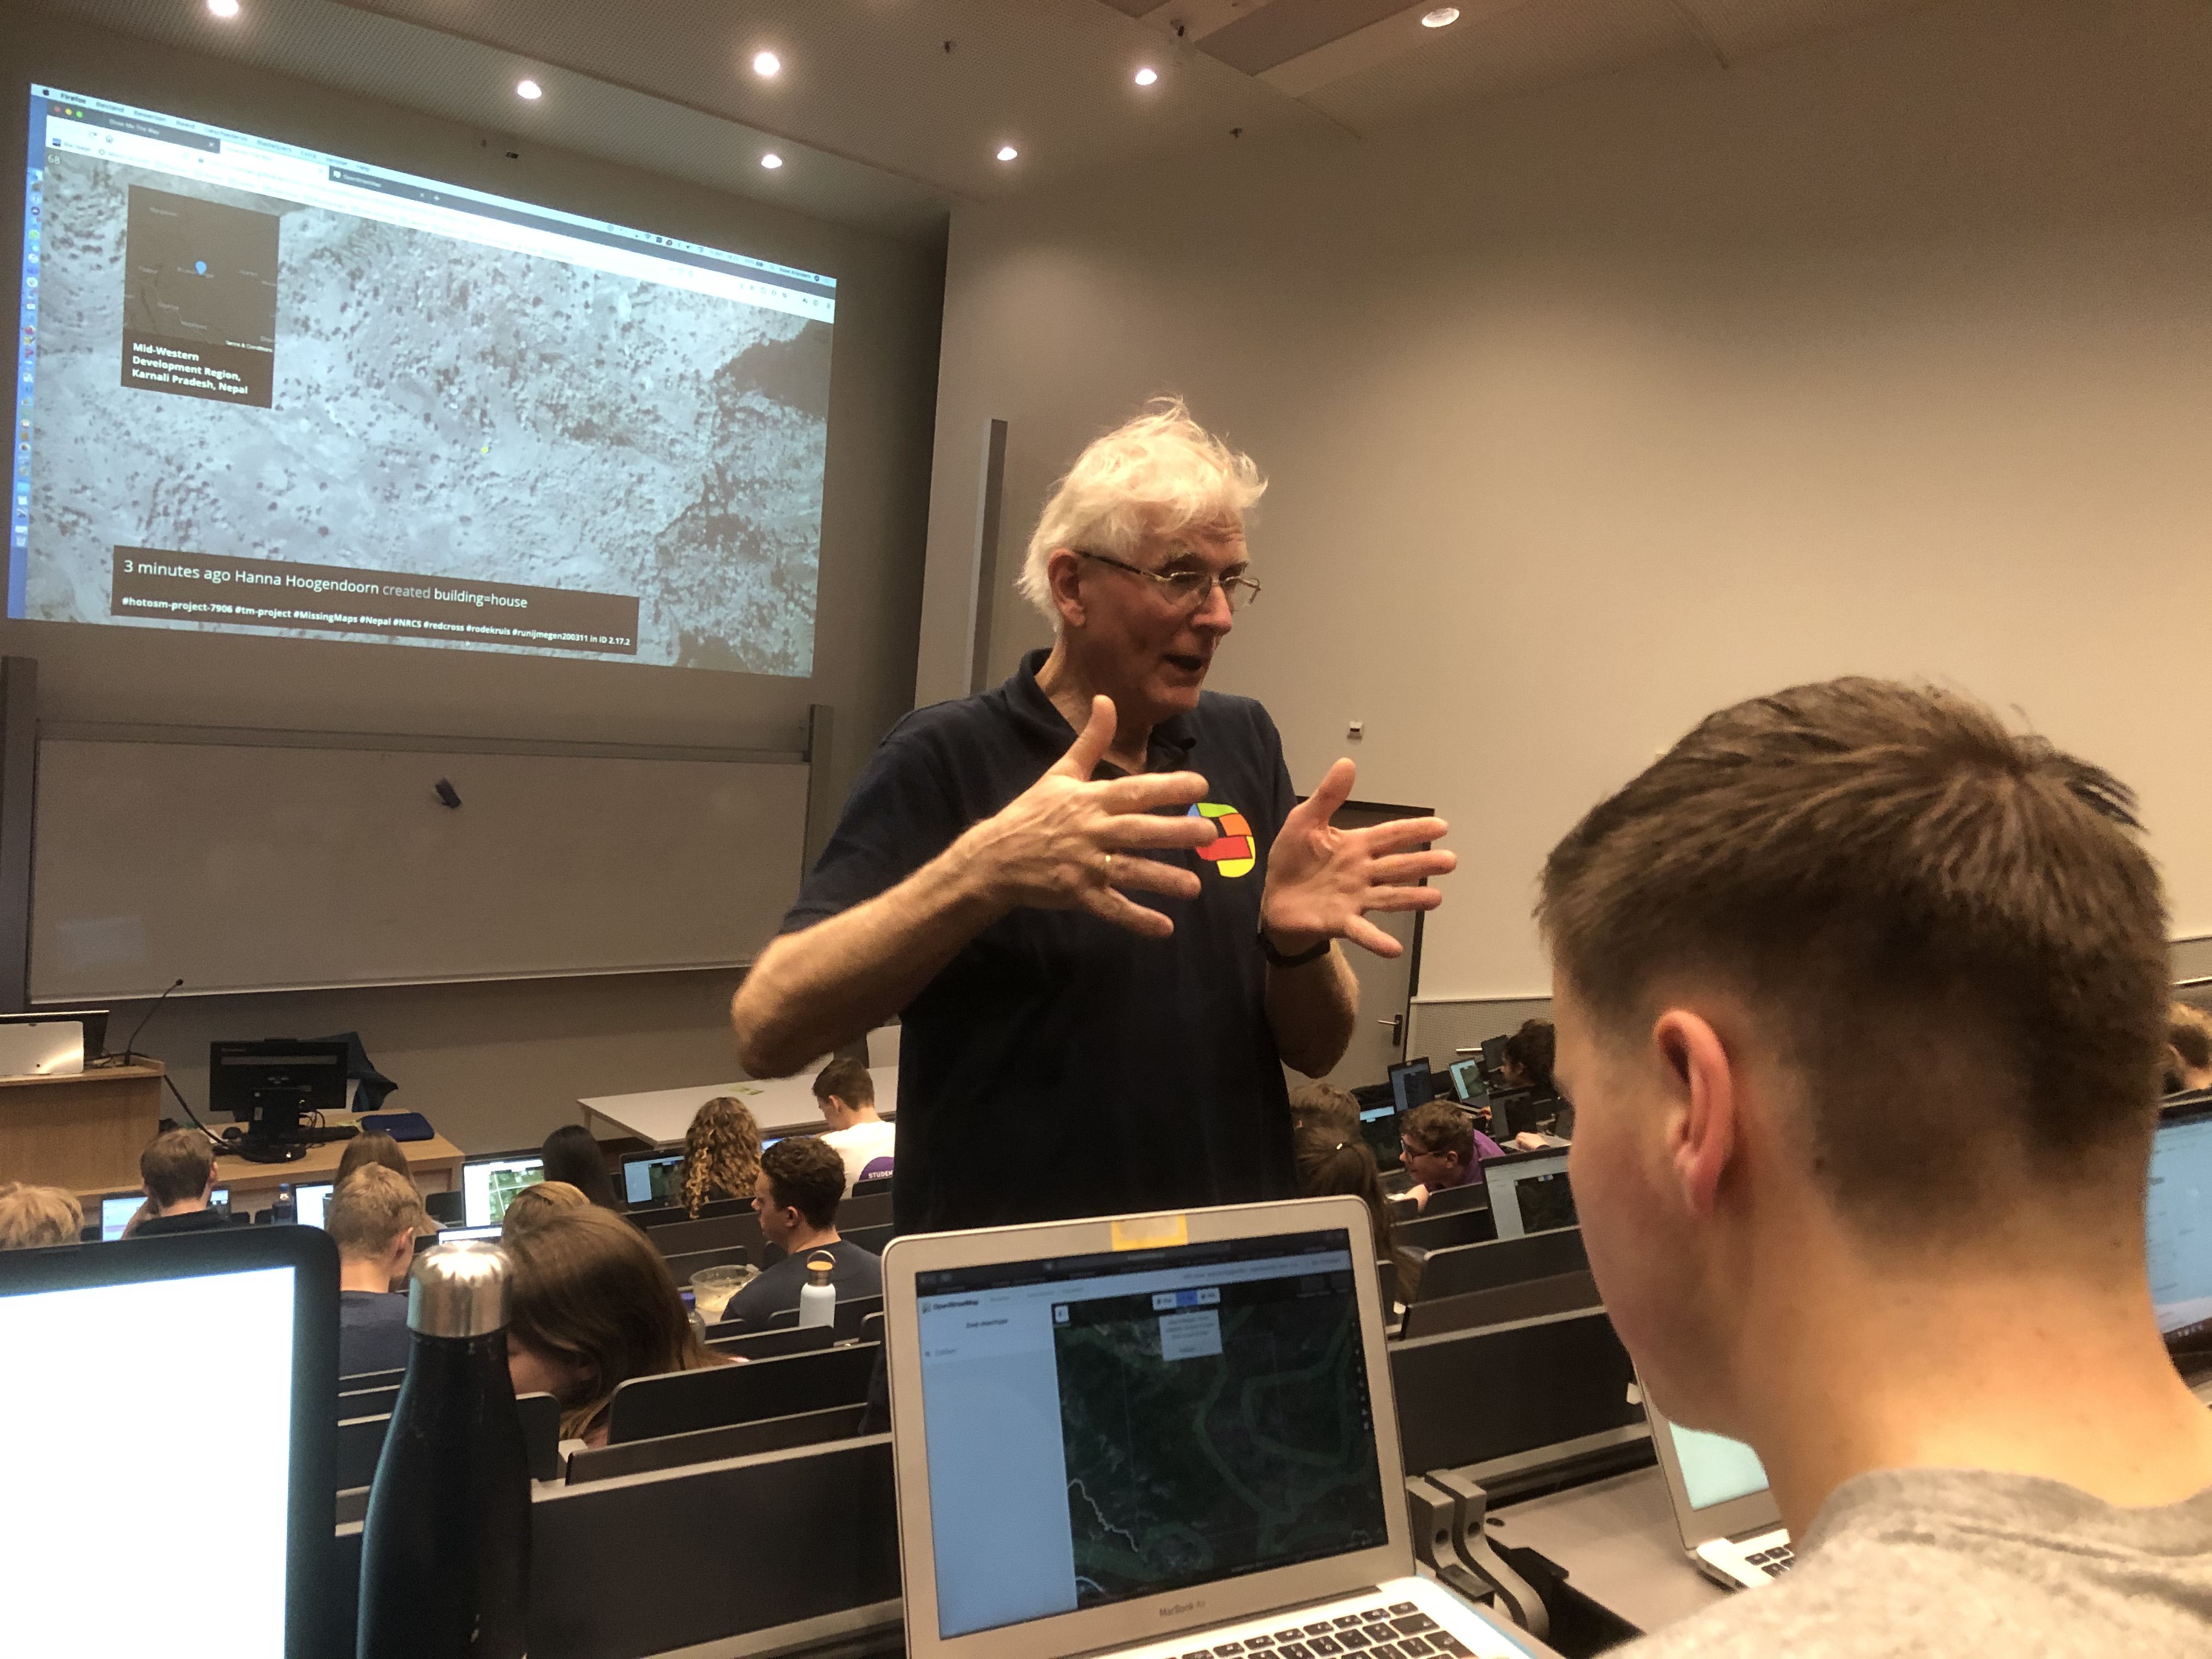
- In 2016 I became involved with the Netherlands Red Cross to further develop Missing Maps. Missing Maps is part of the data team. With a few permanent staff and many interns and volunteers, we want to use information technology to speed up and improve the assistance provided. In my spare time, I prefer to do something that requires maps. Travelling through Europe by bike or backpack and tent. To and fro, preferably by train and certainly not by air. The highlight is the annual winter camp — walking with a bunch of friends in the last weekend of January, pitching a tent, making a campfire. Unfortunately, snow and ice are often missing.
- How and when did you get to know OpenStreetMap?
- My first introduction was in 2004 or 2005. I don’t remember exactly, but I read in an article that a gentleman in Assen, province of Drenthe, while walking his dog drew the map of Assen with the help of GPS by neatly walking over the kerb. And uploading this data to OpenStreetMap. Fascinating that this was possible, but for professional applications completely unusable at the time. Over 10 years later, during the State of the Map in Brussels, I met this gentleman from Assen — he worked for the Netherlands Red Cross and was closely involved with OpenStreetMap and Missing Maps. I had just signed up as a volunteer with the Red Cross to help organise the Missing Maps project!
- How do you use OpenStreetMap?
- Privately I use it for all sorts of things. OpenCycleMap and Komoot for bike tours, openwandelkaart.nl for hiking, Open Camping Map to find campsites, and Openrouteservice to record routes, etc.
- What kind of contributor are you and in which area do you map?
- Almost everything I do is in the context of Missing Maps. I create tasks for areas at the request of aid organisations such as the Red Cross, organise mapathons to get these areas mapped and validated by volunteers, validate a lot myself and if necessary I also map. Validation is badly needed, because a lot of it is done by volunteers with little experience. That is why I put time and energy into training mappers to become validators.
- I don’t have a specific mapping area, although by far most of what I do is in Africa.
- What are you mapping? Do you have a specialisation?
- Aid organisations usually only ask for buildings, roads and waterways.
- In recent years, more than 100 tasks have been created by the Netherlands Red Cross, with several thousand mappers helping out. About 300 000 buildings and 120 000 km of roads and waterways have been mapped. In addition, a similar number of buildings and roads have been mapped from tasks not initiated by the Netherlands Red Cross.
- What is your greatest achievement as mapper?
- That was in 2017 during the major hurricane Irma on Sint-Maarten in the Caribbean. Shortly after the first very alarming reports, we received recent aerial photos from the French IGN. These first had to be edited to get them into the Missing Maps task manager.
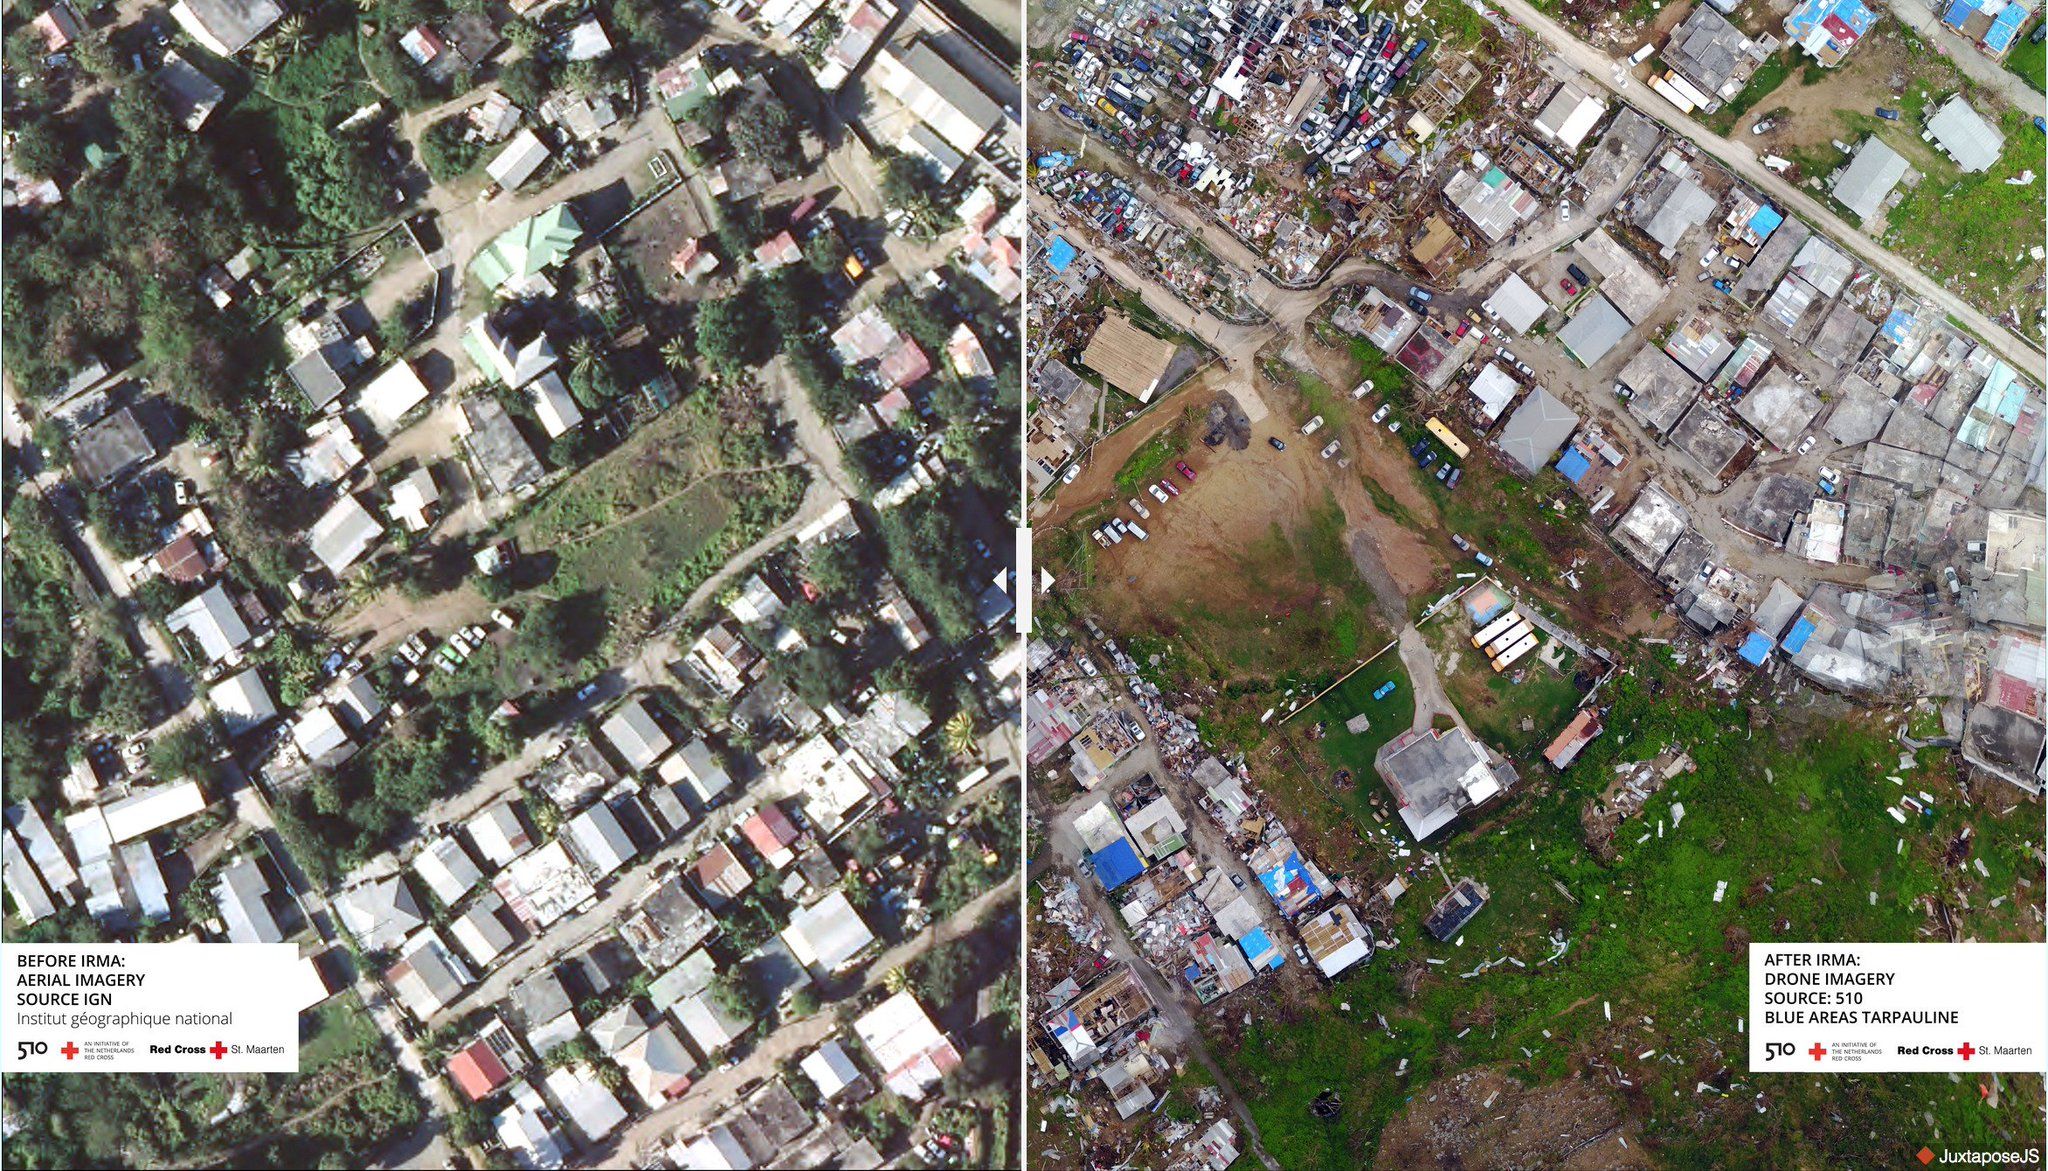
They succeeded and 24 hours later the Dutch part of Sint-Maarten was completely mapped, thanks to a planned mapathon at the faculty of Geo-Information Science and Earth Observation (ITC) in Enschede. Sixty students mapped the entire Dutch part of Sint-Maarten in one evening. The first result (five minutes after everything had been mapped) was already very significant: there were about 13 000 buildings on Sint-Maarten. With an average house occupancy of four people, this meant that approximately 50 000 people lived there and not the 80 000 diets who lived there according to the statistics for Sint-Maarten. This made a world of difference to the relief effort — the first thing that had to be brought in was drinking water. That made a difference of a few planes.. The first relief team had already set off for Sint-Maarten that day, landing first on Curaçao because Sint-Maarten’s airport was unusable. There, the map, which had just been completed, was downloaded. In the first plane to land was a team of the Netherlands Red Cross with this up to date OpenStreetMap! This map was then used intensively in the relief effort, while there was no electricity, internet or mobile telephony available. In the same week, drone images were made of the damage to buildings. Based on this, the most affected areas were selected as priority areas for the relief effort. This is where the centres where food, drinking water, and all kinds of aid materials were distributed were located.
- Why are you mapping? What motivates you?
- A good up-to-date map makes the assistance more effective and faster. An example: in order to plan a vaccination campaign, you need to know where people live, how many there are and how to get there. By counting buildings, we estimate the number of residents, so that you have enough people and vaccines.
- We save lives — you don’t need to talk about motivation.
- Do you have any ideas to expand the OpenStreetMap community, to motivate more people to contribute?
- I try to reach as many companies, associations, educational institutions and government services as possible at trade fairs, in the press, through word of mouth, advertisement, etc. to organise a mapathon. This worked very well in the pre-COVID-19 period. One or two mapathons a week were quite common! This meant many new mappers, who also received a short introduction and some guidance. From these groups, new mappers emerged who I could also contact via email in case of acute requests and ask them to map a particular task. Some of them go on and become enthusiastic mappers and validators.
- Do you have contact with other mappers?
- This corona year much less, but before that a lot. At a mapathon, there were between 25 and 150 participants. That’s thousands of mappers a year.
- I also have my contacts with the Humanitarian OpenStreetMap Team (HOT). Through this organisation you hear about everything that is going on within the Missing Maps community.
- What is in your view the greatest strength of OpenStreetMap?
- Open data — which is improved, expanded and added to by a community and can therefore be used more and more widely. Combining this map data with other data makes OpenStreetMap an indispensable source of geo-referenced data.
- What are the largest challenges for OpenStreetMap?
- To map everything and keep it up to date, also by means of artificial intelligence, the automatic generation of objects based on satellite images, aerial photos, drone images, LiDAR, etc. Google, Facebook and Microsoft do this on a large scale. The strength of OpenStreetMap lies in the local volunteers who are able to add data that you do not see on these images, and that too makes OpenStreetMap unique. At the same time, there is the transition from 2D to 3D. More and more source data is available as open data in 3D. It requires quite a lot to get this right.
- How to do stay on top of news about OpenStreetMap?
- Reddit, State of the Map. But also the geo-world itself is still moving fast and many developments there influence both the acquisition and processing of data for OpenStreetMap and the use of OpenStreetMap. And it is the latter that we need.
- To conclude, is there anything else you want to share with the readers?
- Great to see so many people enthusiastic about something as simple as mapping…
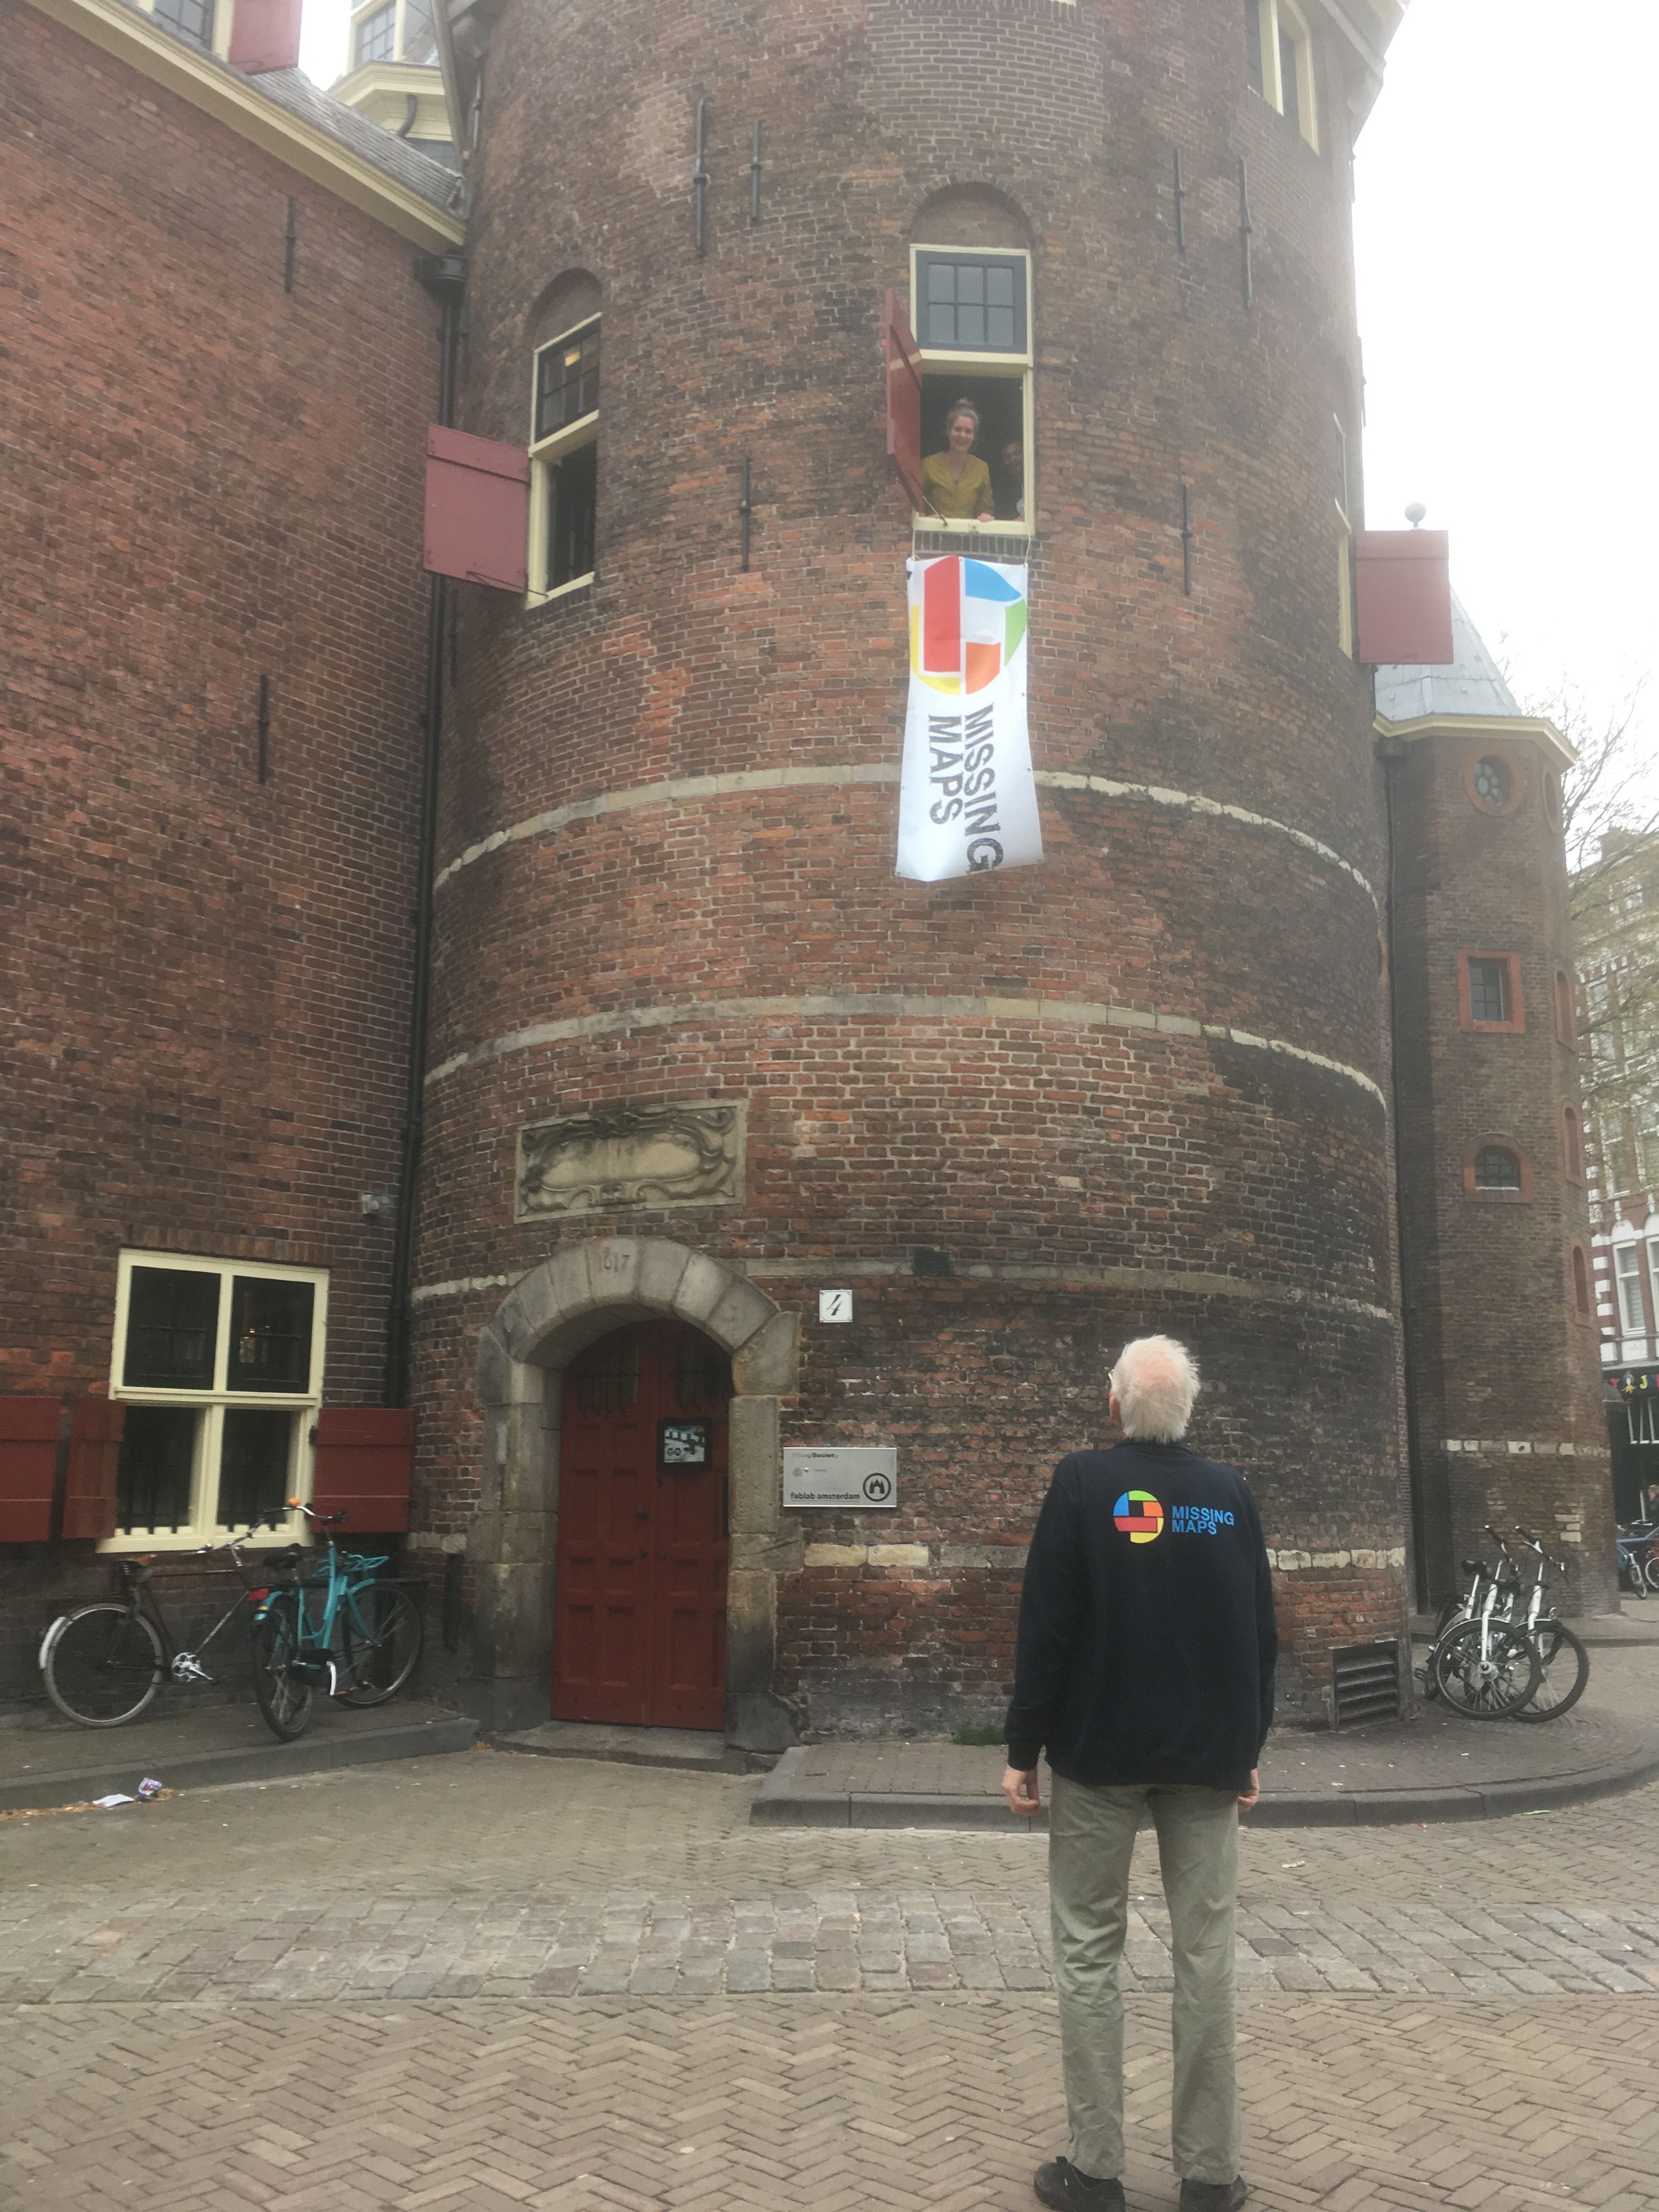
- The datateam of the Netherlands Red Cross is called “510”. 510 million square kilometres is what our earth is made of. The area that OpenStreetMap is also going for.
Thank you, Koos, for this interview.
Translated from Dutch by Claire Muyllaert and Pierre Parmentier with the help of www.DeepL.com/Translator.